Play Analyzer
Post-game charts, tendency breakdowns, and AI scouting reports.
Overview
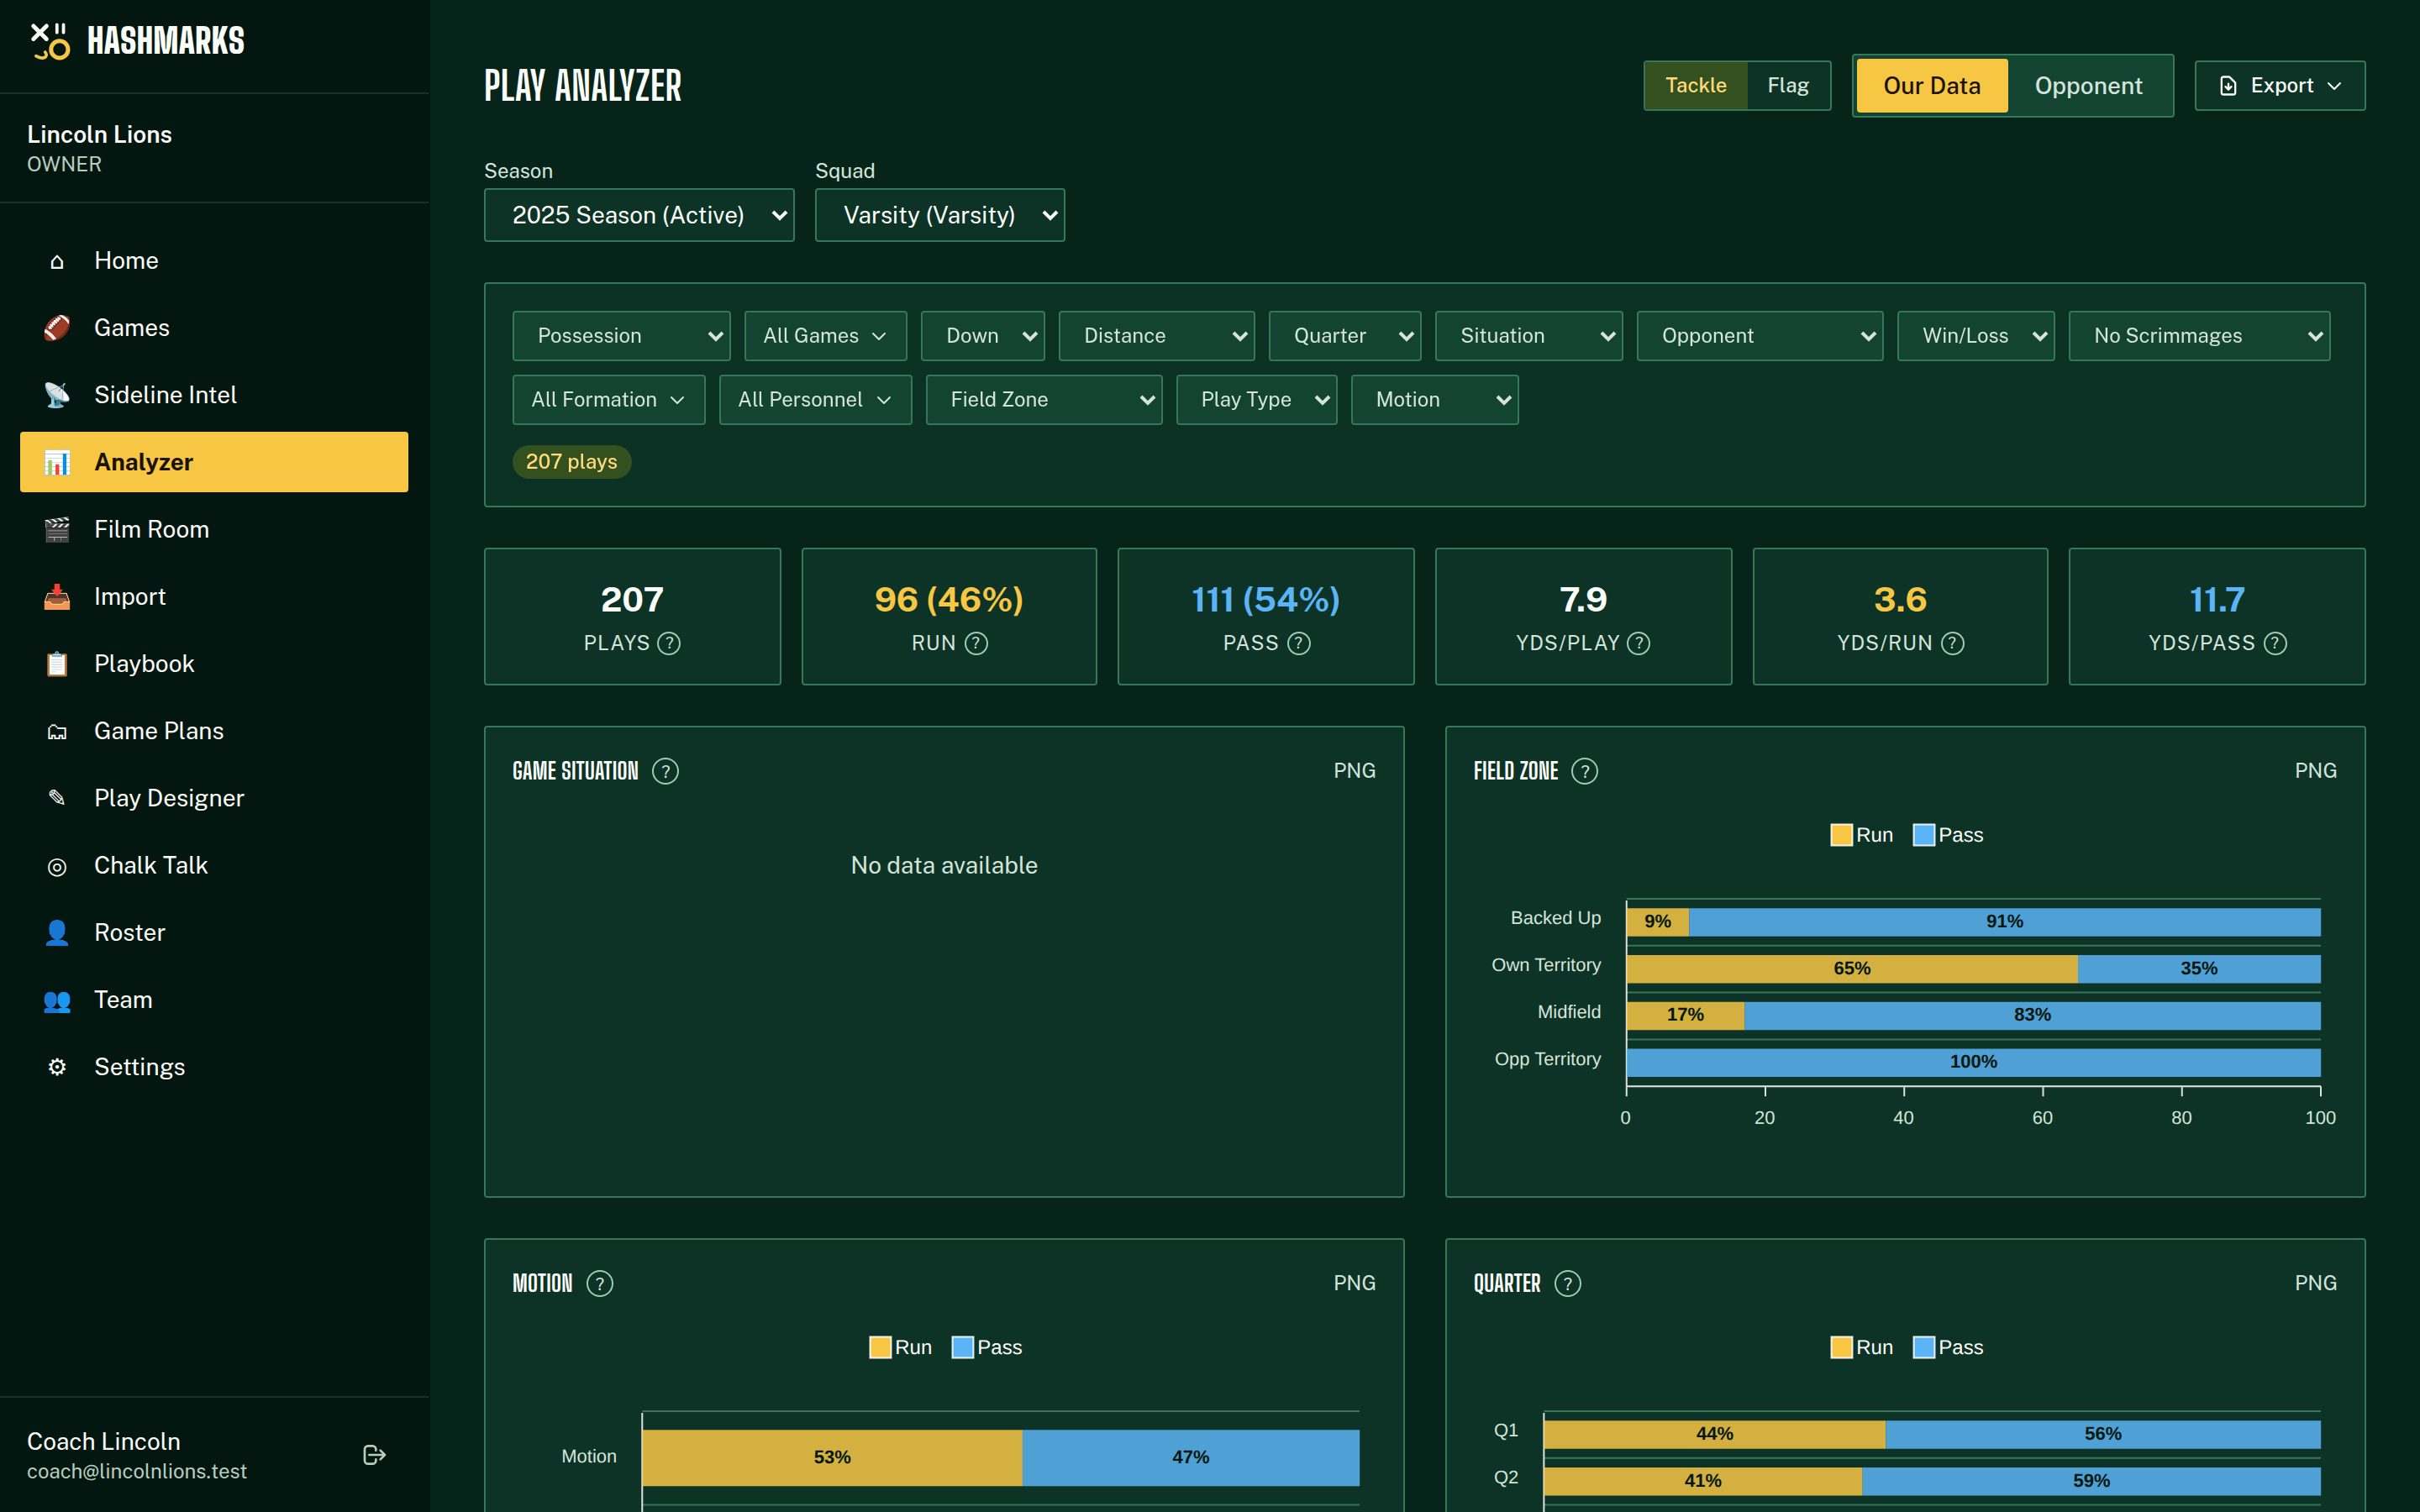
The Play Analyzer takes all your logged or imported play data and generates interactive charts, formation breakdowns, and statistical summaries. Use it for post-game film study, weekly scouting, or season-long trend analysis.
How to Use It
Navigate to Analyze
Select your data
Apply filters
Explore the charts
Chart Guide
Each chart reveals a different dimension of your play data. Here's what they show:

Tendency Bars
Stacked horizontal bars showing run/pass split by game situation (ahead/behind/close), field zone, motion usage, and quarter. Click any segment to filter.
Run Likelihood Heatmap
A grid of down (rows) vs. distance (columns) colored by run percentage. Red = heavily run, blue = heavily pass. Identifies predictable tendencies.
Formation Frequency
How often each formation is used. Tall bars = base formations. Short bars = situational sets.
Formation Yards
Average yards per play from each formation. A dashed line shows the overall average for comparison.
Top Play Calls
The 20 most-called plays ranked by frequency. Each bar shows count, average yards, and success rate.
Skill Players
Top ball carriers (by carries) and pass targets (by targets). Shows volume and efficiency for your key playmakers.
Explosive Play Scatter
Each play plotted by field position (X) and yards gained (Y). Plays above the explosive threshold (12 for runs, 16 for passes) are highlighted.
Sankey Diagram
Flow diagram showing Formation → Play Type → Play Call connections. Thicker bands = more plays. Reveals which formations feed into which play calls.
Success Rate by Down
Bar chart showing success rate per down. Green (50%+), yellow (35-50%), red (below 35%).
Quarter Performance
Side-by-side metrics per quarter: total plays, yards/play, run%, and explosive rate.
Scoring Margin Tendency
Line chart showing run% vs. point differential. Reveals how play calling changes when ahead vs. behind.
Data Tables
Game Summary
One row per game with W/L, score, plays, and run/pass split. Click any row to filter all charts to that game.
Formation Breakdown
Expandable rows showing play call details per formation. Drill into specific formations to see every play run from them.
All Plays
Sortable, searchable, paginated table with every play. Export to CSV for further analysis in a spreadsheet.
AI Scouting Report
Generate an LLM-powered defensive game plan from your filtered data. Configure your API key (OpenAI or Anthropic), review the auto-generated prompt, and generate a detailed scouting report with defensive recommendations. Export as PDF for your coaching packet.
ℹ️Best Results
The AI scouting report works best with 100+ plays of data. Use season-level data or combine multiple games for the most actionable insights.
💡Power User Tips
- Start broad (entire season) then narrow down with filters to find specific patterns.
- Compare "Our Data" vs. "Opponent" to prepare game-specific plans.
- Export individual charts as PNG for presentations or scouting packets.
- Click any formation bar or tendency category to filter the entire analysis instantly.