Football Advanced Stats for High School Coaches
Football advanced stats explained for coaches: success rate, explosive plays, 3rd-down and red zone numbers, and how to read them on game day and Sunday.
By Hashmarks4 min readScouting
Your tailback averaged 5.1 yards a carry and you still couldn't stay on schedule. One 60-yard run on a busted play covers a lot of 1-yard gains. Football advanced stats exist to see past that: they grade every snap against the situation it was called in, so a 3-yard run on 3rd & 2 counts as a win and a 6-yard run on 3rd & 9 doesn't.
This guide covers the handful of numbers worth your staff's time, how to read them without fooling yourself, and where to find them in Hashmarks.
Why yards per play lies
Averages get dragged around by the big play. A back with twelve carries for 3, 2, 0, 4, 1, 3, 2, 60, 1, 2, 3, 0 "averages" 6.75 yards. Eleven of those twelve carries left you behind the chains.
Coaches already know this in their gut. The advanced stats just write it down:
- Did the play keep us on schedule? That's success rate.
- Did it change the game? That's explosive plays.
- Did we finish? That's third down, fourth down and the red zone.
Success rate: the stat that grades every snap
A play is a success in the Hashmarks dashboards when it gains:
- 4 or more yards on 1st down
- half the distance on 2nd down
- a first down or touchdown on 3rd or 4th down
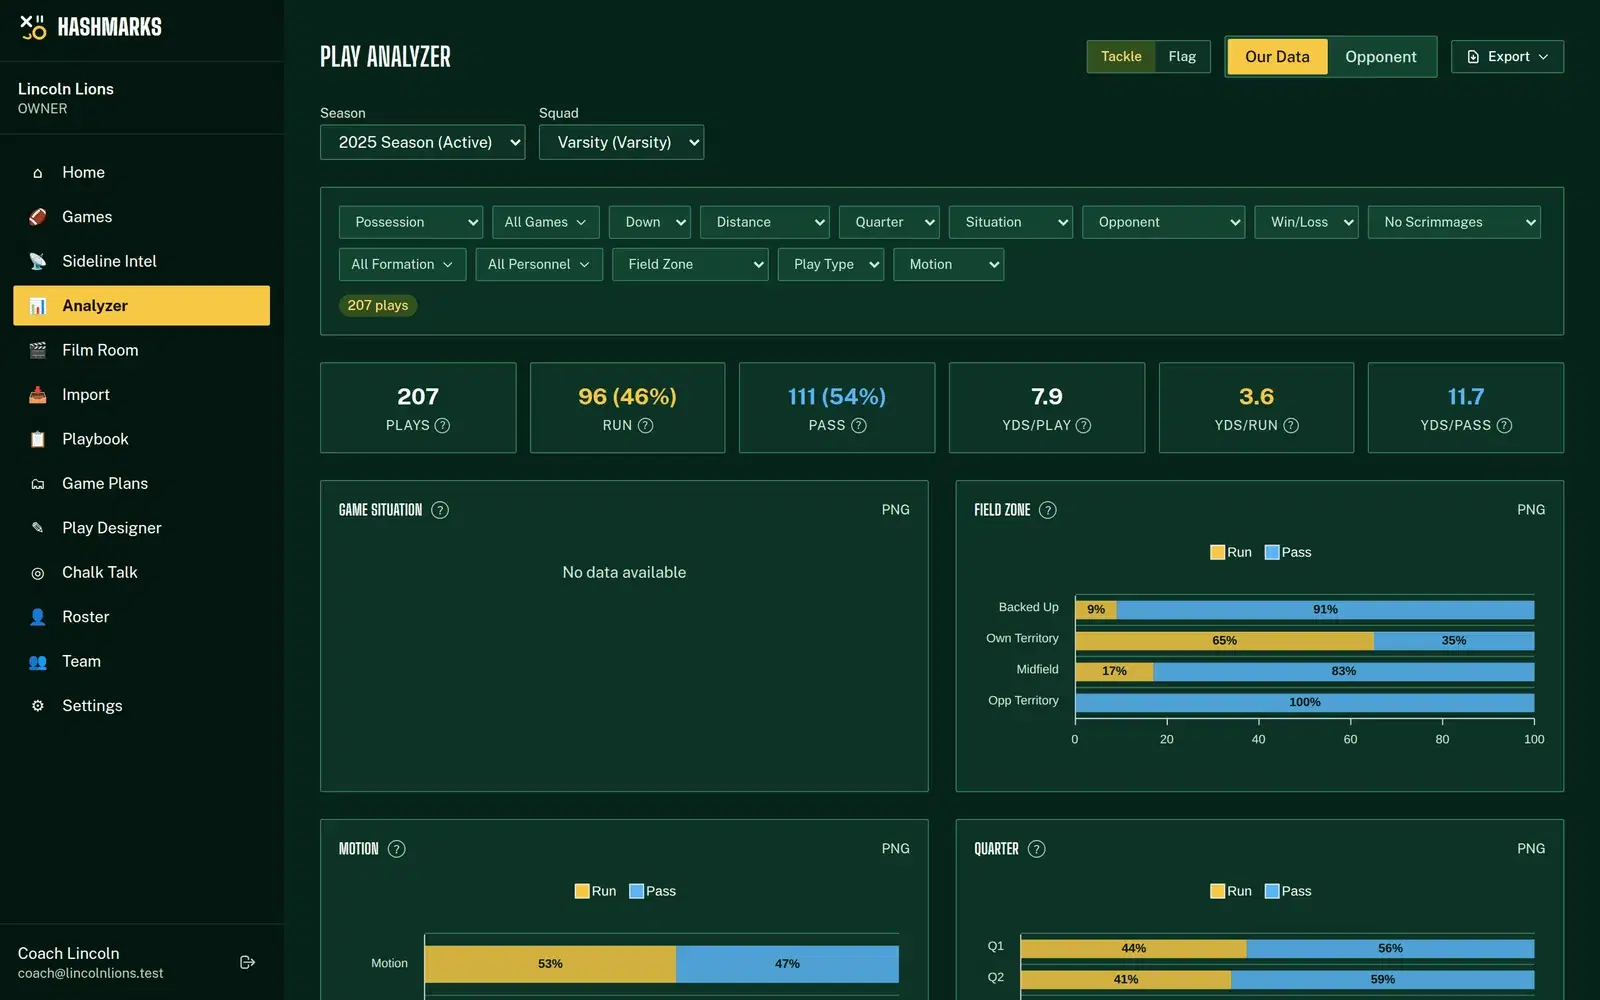
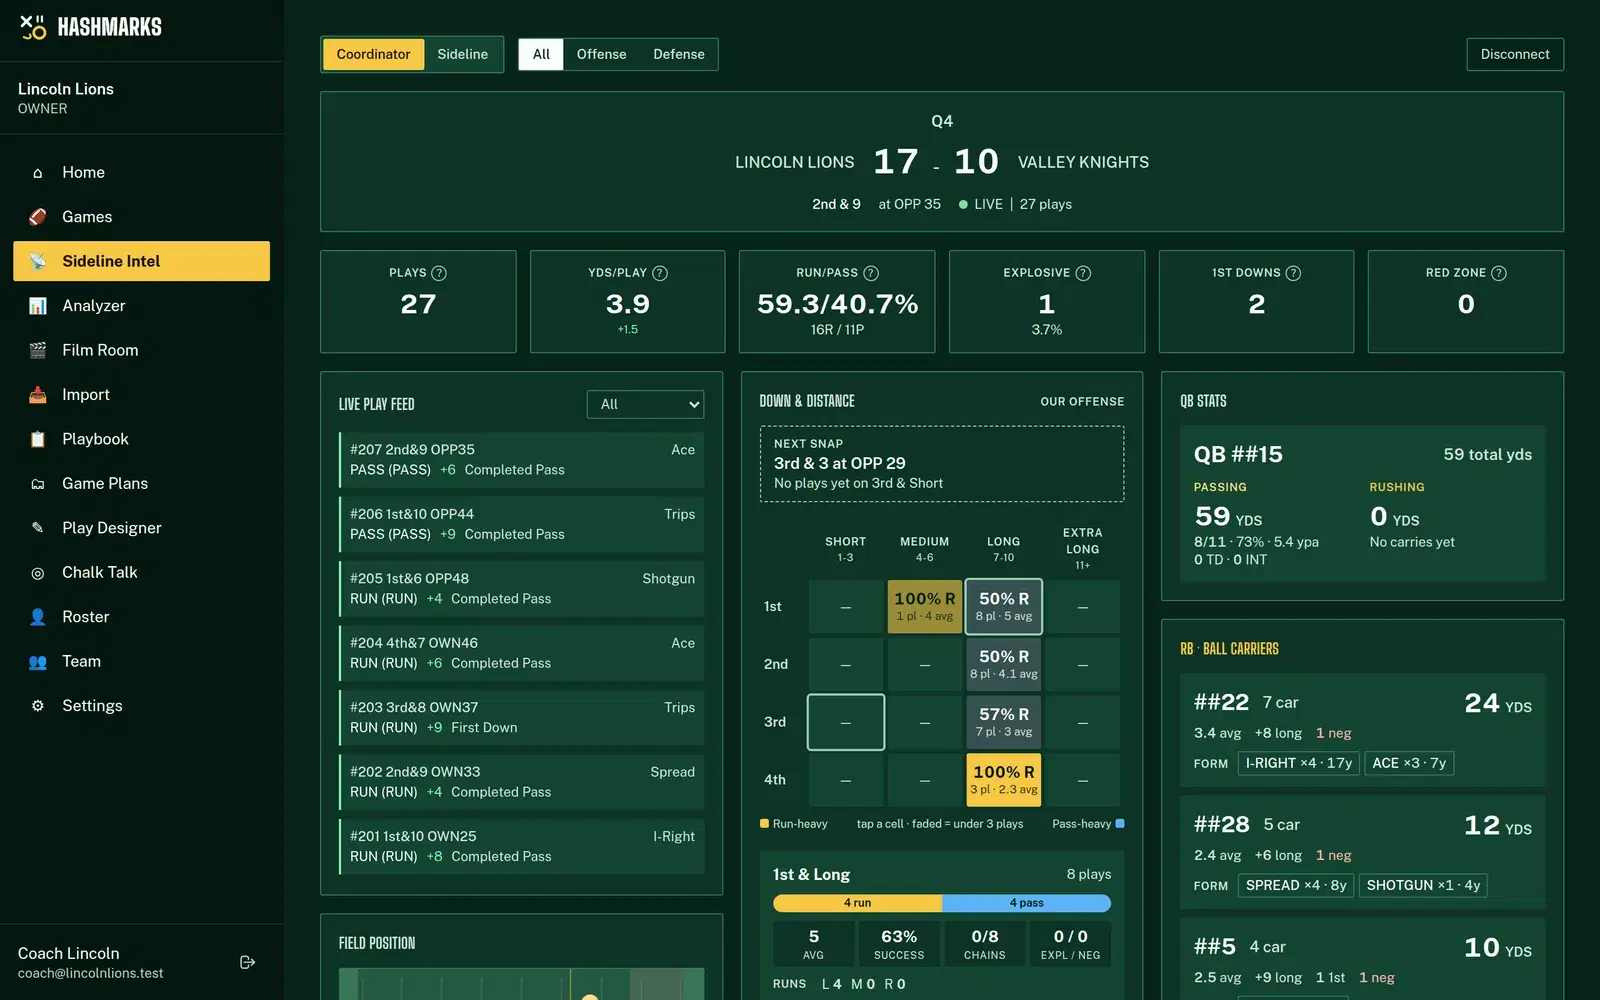
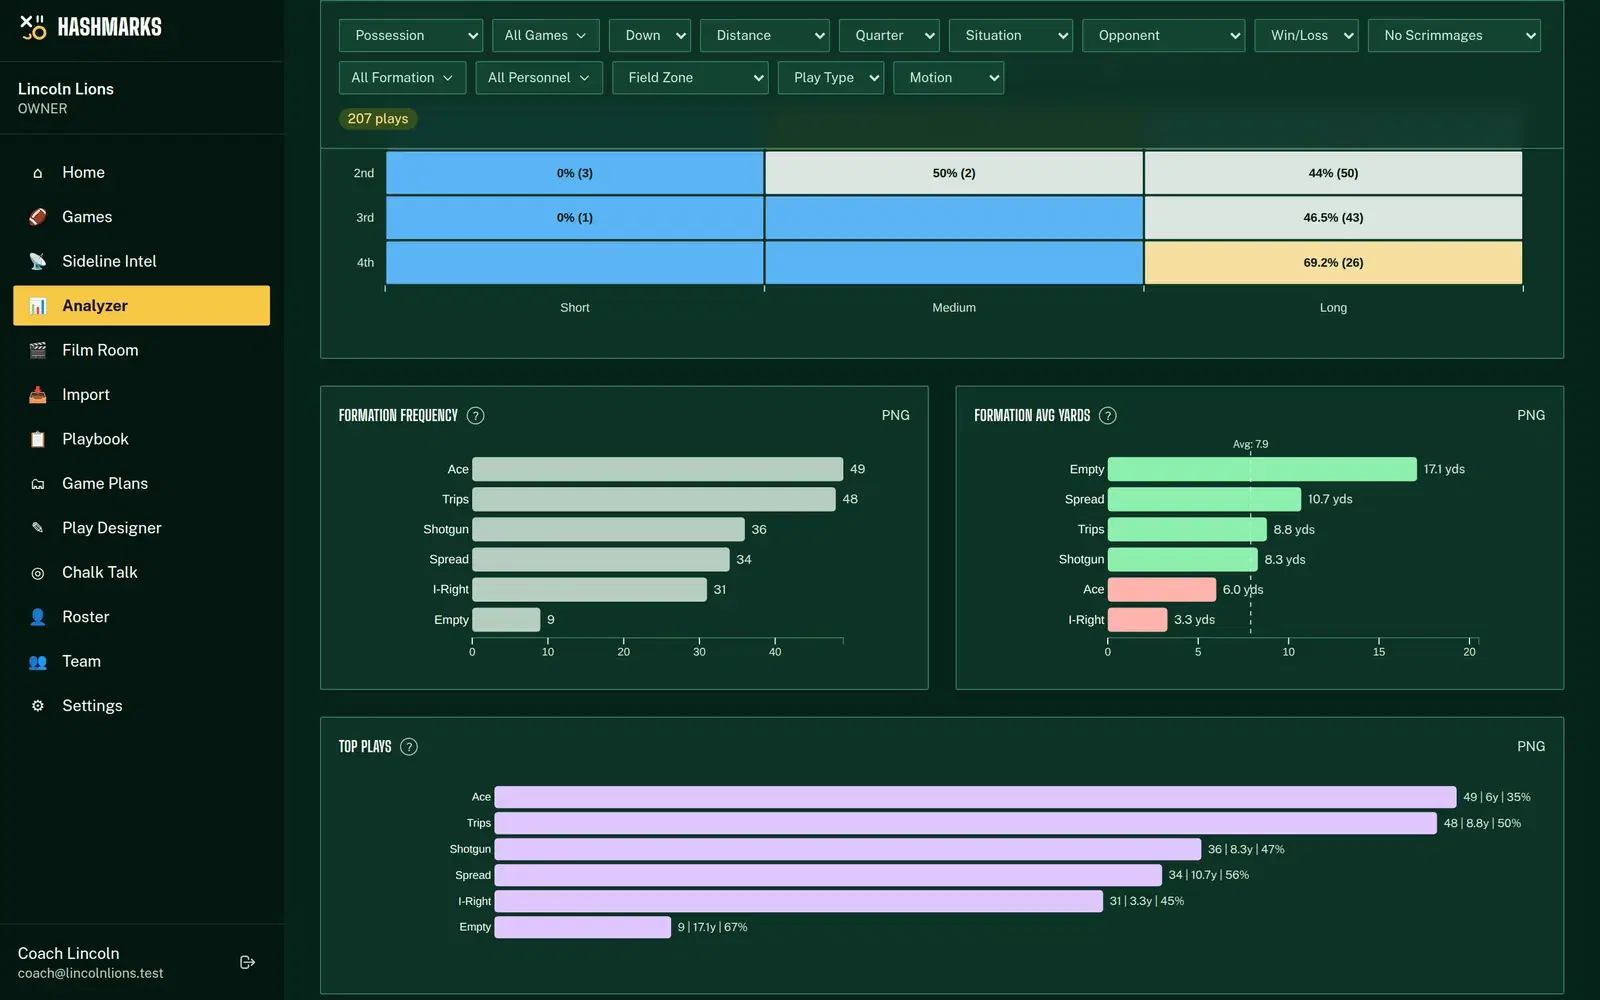
Count the successes, divide by the plays, and you have a success rate. You'll see it by down, by play call and by personnel group in the Play Analyzer, and in the breakdown for each down-and-distance cell in Sideline Intel.
The Success Rate report grades harder
The Success Rate tab in the Analyzer (and a Success Rate view in Sideline Intel) uses a stricter line, closer to what NFL staffs chart: 50% of the yards to go on 1st down, 70% on 2nd, and 100% on 3rd and 4th. If that's too tough for your level, switch it to 40 / 60 / 100. A touchdown always counts, a lost fumble never does, and special teams, kneels and plays wiped out by a penalty are left out.
The report groups plays into families from the play call you logged, so "Power Rt" and "Power Lt" count together as Power. It then shows:
- success by down for runs, screens, play-action and dropback passes
- Takeaways: plays you lean on that are below your team rate, and plays you rarely call that beat it
- Short yardage and goal line: 2 yards or fewer to go, or at the opponent's 5 and in, graded on converting
- the dropback game broken out by concept, and every play in each family
It's the fastest way to answer the Monday question: what do we actually do well?
Explosive plays: the ones that flip the game
Hashmarks counts a run of 12 or more yards or a pass of 16 or more as explosive. The Analyzer plots every play by field position and gain so you can see where they came from, and counts them by quarter. On defense, explosive plays allowed is the first number to check after a loss.
Success rate and explosives work as a pair. An offense with a high success rate and few explosives has to drive the length of the field every time. An offense living on explosives with a low success rate is one bad bounce from a three-and-out.
Third down, fourth down and the red zone
- 3rd and 4th down conversions are split by run and pass and by distance on the Sideline Intel board, so you can see whether 3rd & medium is a run or a throw for your offense, or theirs.
- Red zone trips and results show whether you score touchdowns or settle.
- On defense, tackles for loss and sacks by unit tell you who's winning up front.
Reading the numbers without fooling yourself
- Watch the sample. Sideline Intel fades any cell with fewer than three plays for a reason. Four plays is an anecdote. Twenty is a tendency.
- Compare, don't admire. A 45% success rate means nothing alone. Compare it by down, by formation, against your season average and against last week.
- Chart the result you care about. If you log only gain and loss, success rate still works. If you log first downs and touchdowns as results, 3rd-down success gets exact.
- Look at the halves. The Halftime report puts your first-half success, explosives and "working / not working" notes on one screen, and in the Analyzer it compares halves across your games.
How to do it in Hashmarks
- Request free access and add your season.
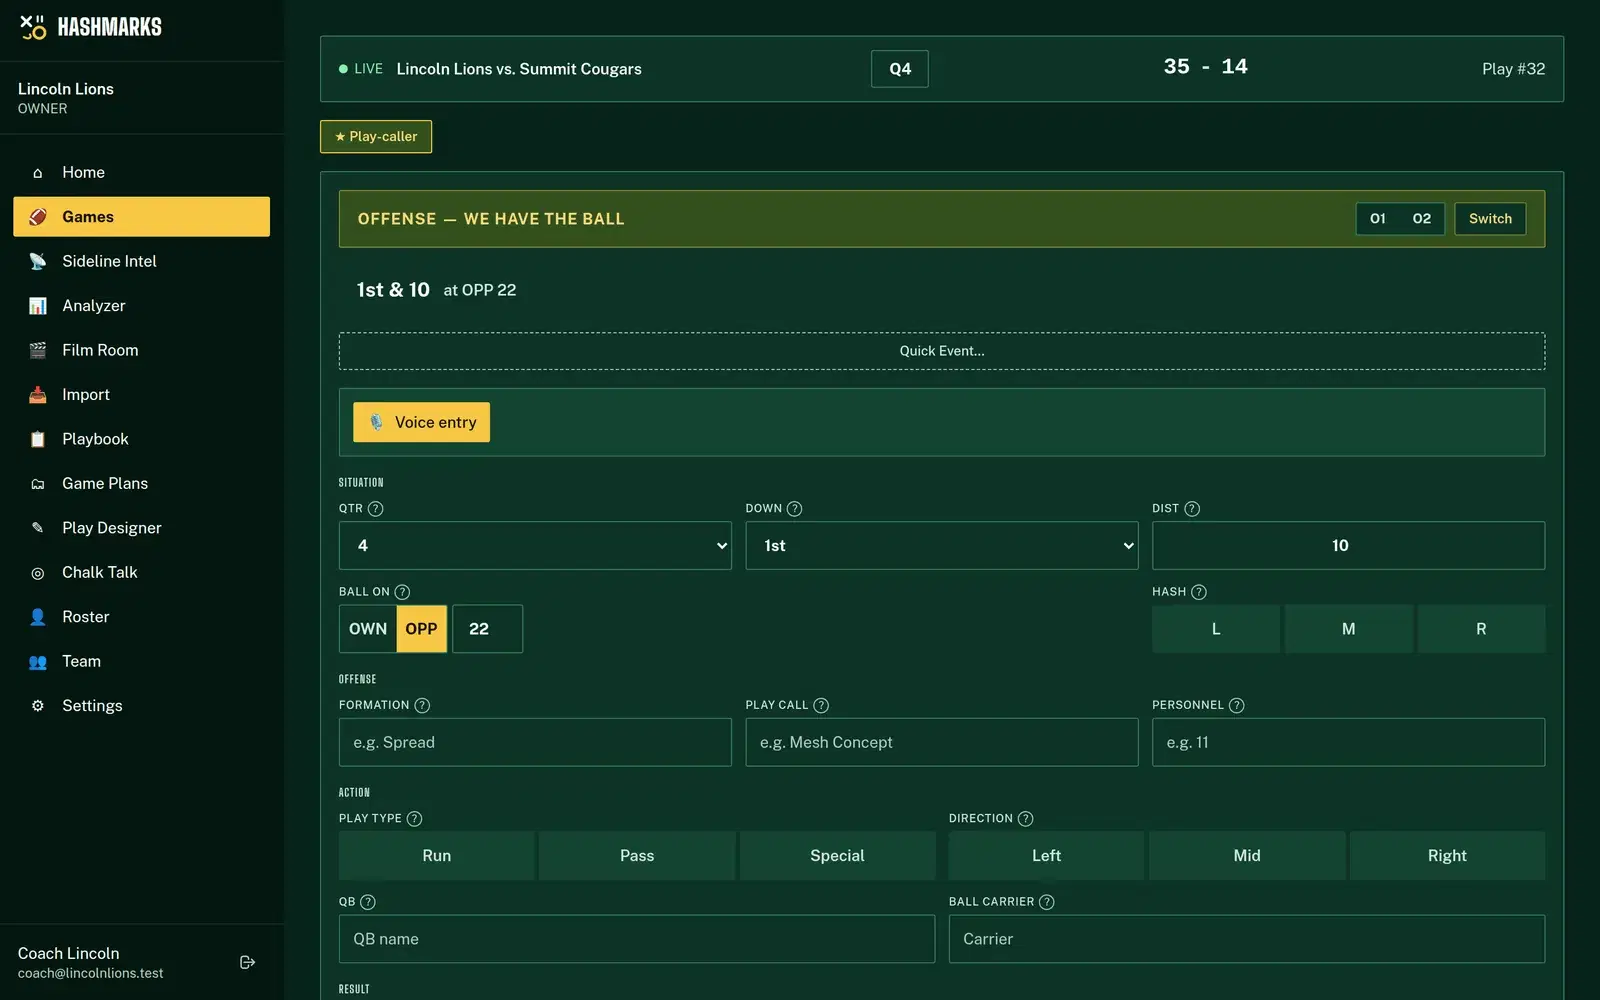
- Get plays in. Chart games live with the Play Tracker (formation, play call, play type, gain and result are enough), or import a breakdown CSV. See CSV import help.
- Open Analyzer, pick the season and Our Data or Opponent.
- Read success rate by down and by play call on the dashboard, then open the Success Rate tab for play families and takeaways.
- Filter by down, distance, field zone or formation to check a hunch.
- Export charts as PNG, the plays as CSV, or the whole report as a PDF for the staff meeting.
The Play Analyzer help page walks through every chart. For quarterback comparisons, see QB reports.
Where the stats fit in your week
- Friday: watch success rate and 3rd-down numbers live on the sideline.
- Halftime: open the Halftime report and pick one adjustment.
- Sunday: run the Success Rate report on your own offense and circle two plays to call more and one to call less.
- Monday: import next week's opponent and look at their explosive plays and 3rd-down calls.
Start grading every snap
Yards per carry will keep lying to you. Success rate won't. Request free access, chart your next game and see which calls actually keep you on schedule. More on the Analyzer on the Hashmarks home page.