Free Hudl Alternative for Scouting Reports and Tendencies
A free Hudl alternative for scouting: import your Hudl CSV, keep every column, get tendency charts, NFL-style advanced stats and a printable report.
By Hashmarks5 min readScouting
If you're searching for a free Hudl alternative, you're probably not trying to throw out your film. You're trying to get answers out of your breakdown data without another subscription or another afternoon in a spreadsheet. That's the job of the Hashmarks Play Analyzer: bring in the plays you've charted or broken down, filter them the way a coordinator thinks, and hand your staff a scouting report they can read.
Keep Hudl for video if you like it. Hashmarks handles the charting, tendencies and scouting, free, and imports your Hudl data.
What a scouting report needs to answer
Whether it's your own offense or next week's opponent, the questions don't change:
- What do they run on each down and distance, and from which formations?
- Which personnel groups and formations tip run or pass?
- Where do the explosive plays come from?
- Which calls and personnel groups actually win: success rate, explosives, third down?
- How do they call it when they're ahead, behind or in the red zone?
The Play Analyzer answers each of those from your play data, and every chart updates when you change a filter.
Bring your data in: Hudl CSV import that keeps every column
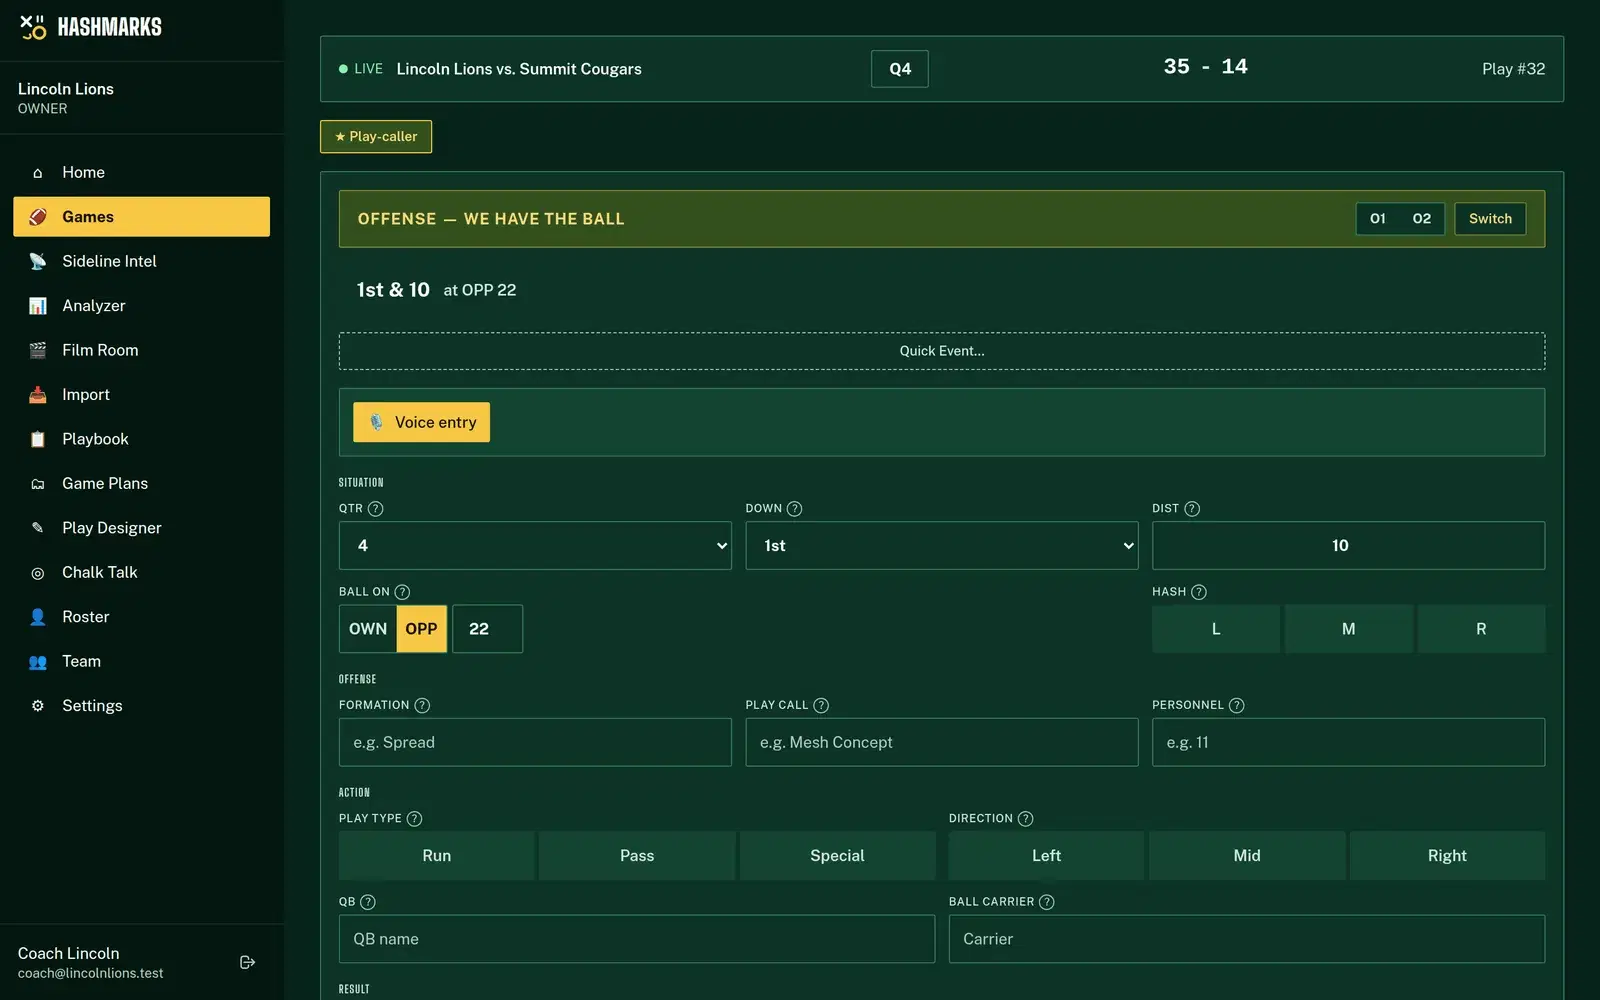
You have two ways to get plays into Hashmarks. Chart them live with the Play Tracker, or import a breakdown you already have.
The CSV import recognizes Hudl-style column names, like ODK, DN, DIST, YARD LN, OFF FORM and GN/LS, and maps those columns for you. You review every mapping before anything is saved and check a preview of the first rows.
What makes it different: imports never drop data.
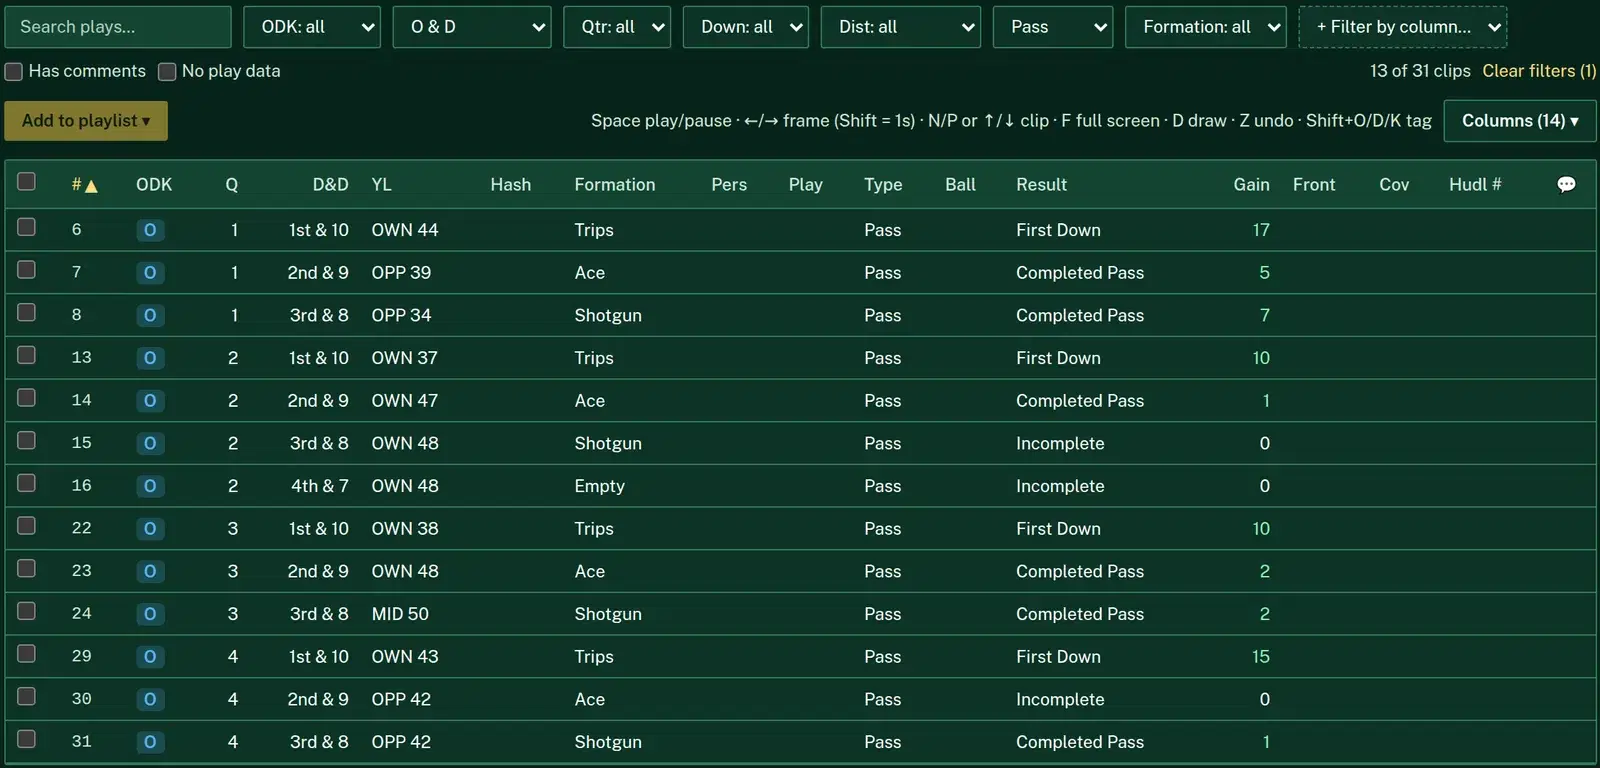
- Hudl's standard columns map to Hashmarks play fields, including ones without a dedicated field (series, backfield, pass zone, defensive personnel, tacklers, kick and return yards and more), which are kept as named extras.
- Your staff's custom columns are kept too, stored with each play.
- Values that don't parse aren't thrown away. They're stored alongside the play.
- A column is only dropped when you explicitly choose Skip.
Those extra columns show up later as columns you can add to the Film Room clip list. You can import a single game, a whole season (map the opponent and date columns and the games are split out for you) or scouting data for an opponent. Files up to 50 MB.
This post is about what Hashmarks does, not about Hudl's plans or pricing. For a feature-by-feature look, see the comparison table on our home page.
Filter like a coordinator
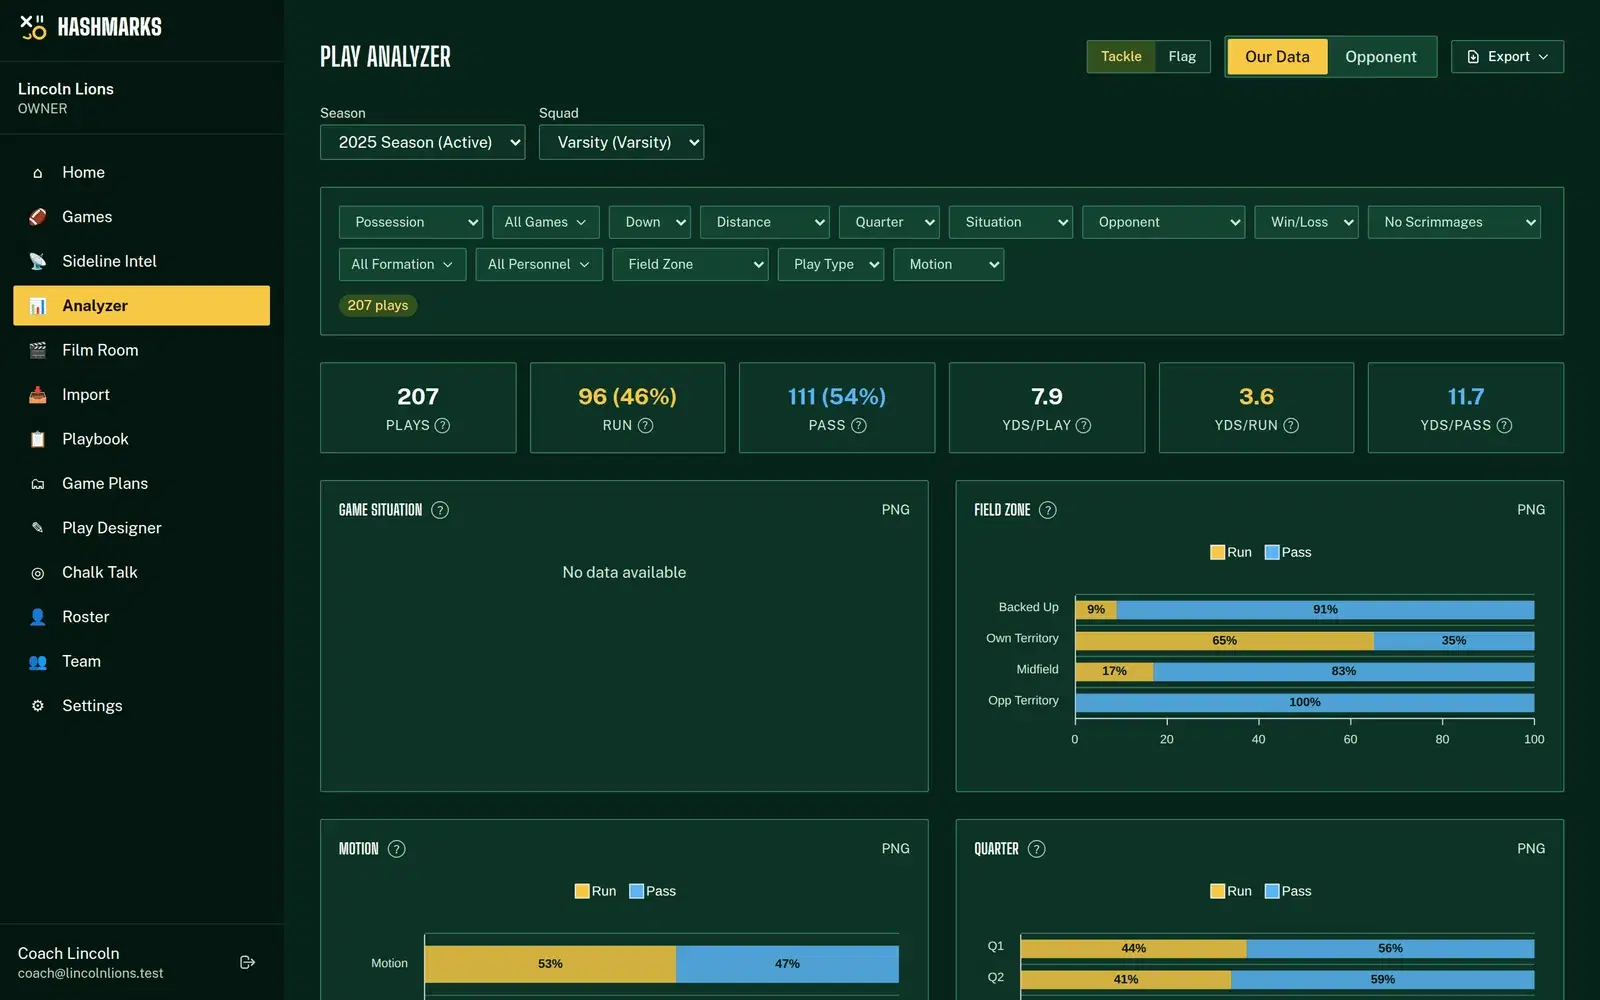
Pick a season, then switch between Our Data and Opponent data. Narrow it with filters for possession, game, down, distance, quarter or half, game situation, opponent, win or loss, formation, personnel, field zone (backed up to red zone), play type and motion. Click a chart segment or a table row to filter by it.
The charts
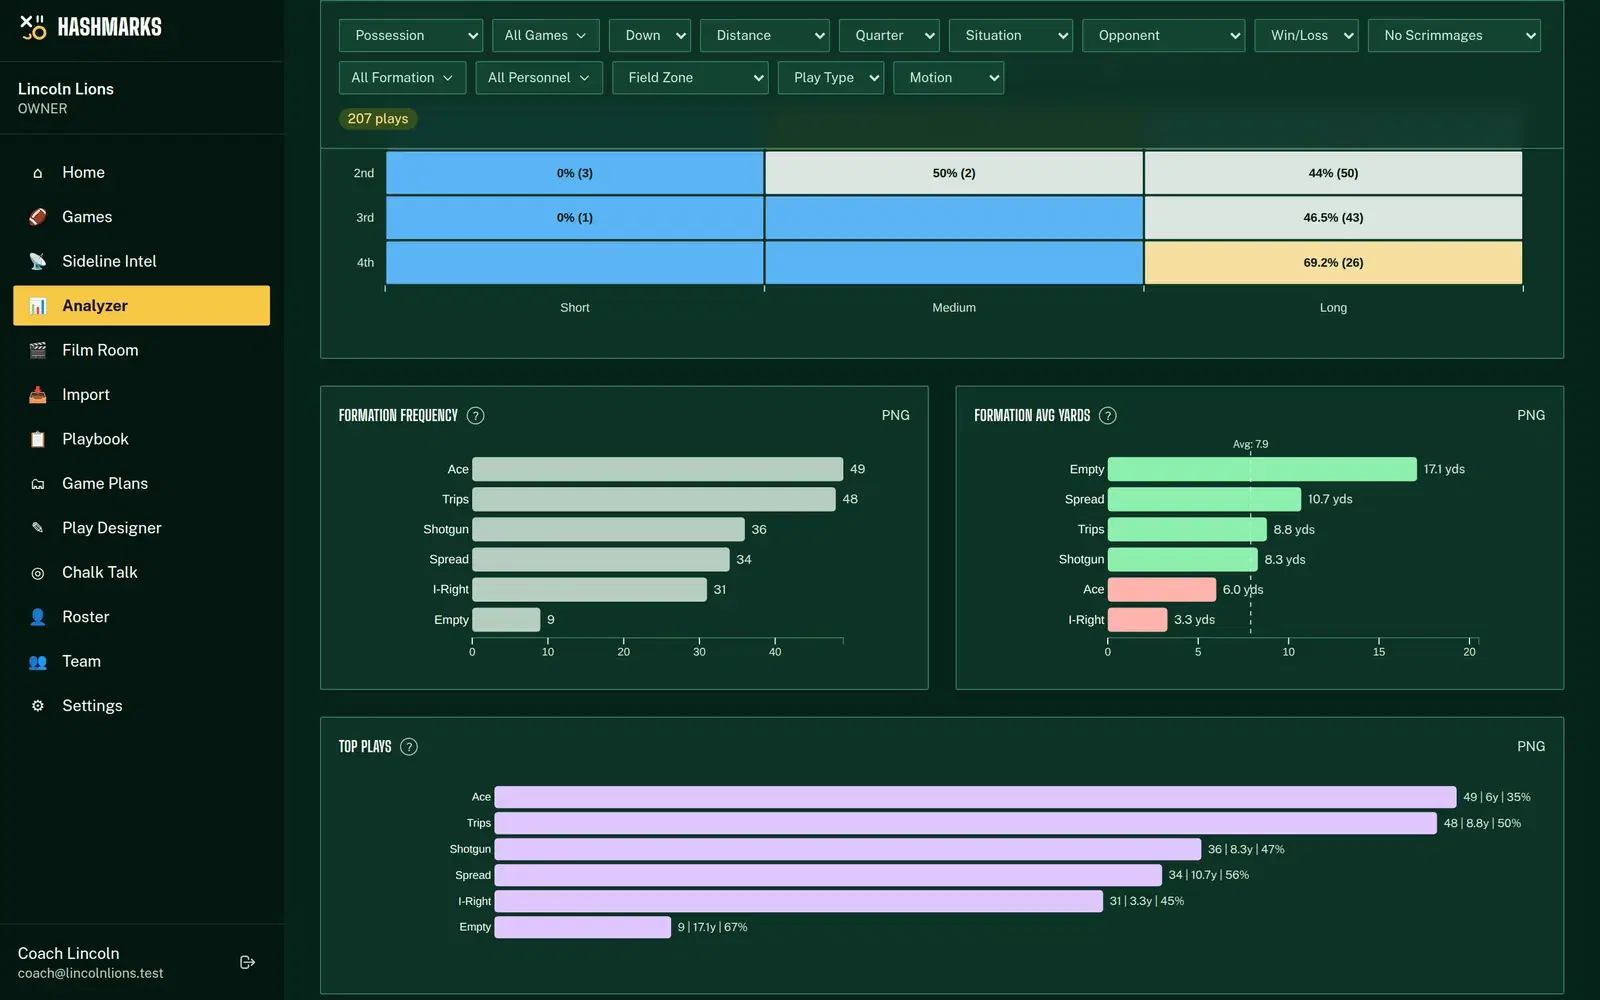
The Analyzer includes:
- Run likelihood heatmap by down and distance, to spot predictable situations
- Tendency bars for run/pass by game situation, field zone, motion and quarter
- Formation frequency and yards per play by formation, against the overall average
- Top play calls, ranked by use with average yards and success rate
- Skill players: top ball carriers and targets
- Explosive play scatter: every play by field position and gain (explosive = 12+ on a run, 16+ on a pass)
- Formation → play type → play call flow (a Sankey diagram)
- Success rate by down, quarter performance and run percentage by score margin
- Personnel analysis and drive summaries
Below the charts are a game summary table, a formation breakdown you can expand into every play, and a searchable, sortable table of all plays. For tackle games there's also a defensive dashboard (their offense against your defense) and position-battle comparisons built from your spotter fields.
NFL-style advanced stats
Yards per carry only tells you so much. Hashmarks tracks the efficiency numbers NFL staffs use, from the plays you chart:
- Success rate: a play is a success when it gains 4+ yards on 1st down, half the distance on 2nd, or moves the chains on 3rd and 4th. You'll see it by down, by play call and by personnel group.
- Explosive plays: 12+ yards on a run, 16+ on a pass, plotted by field position and tracked by quarter.
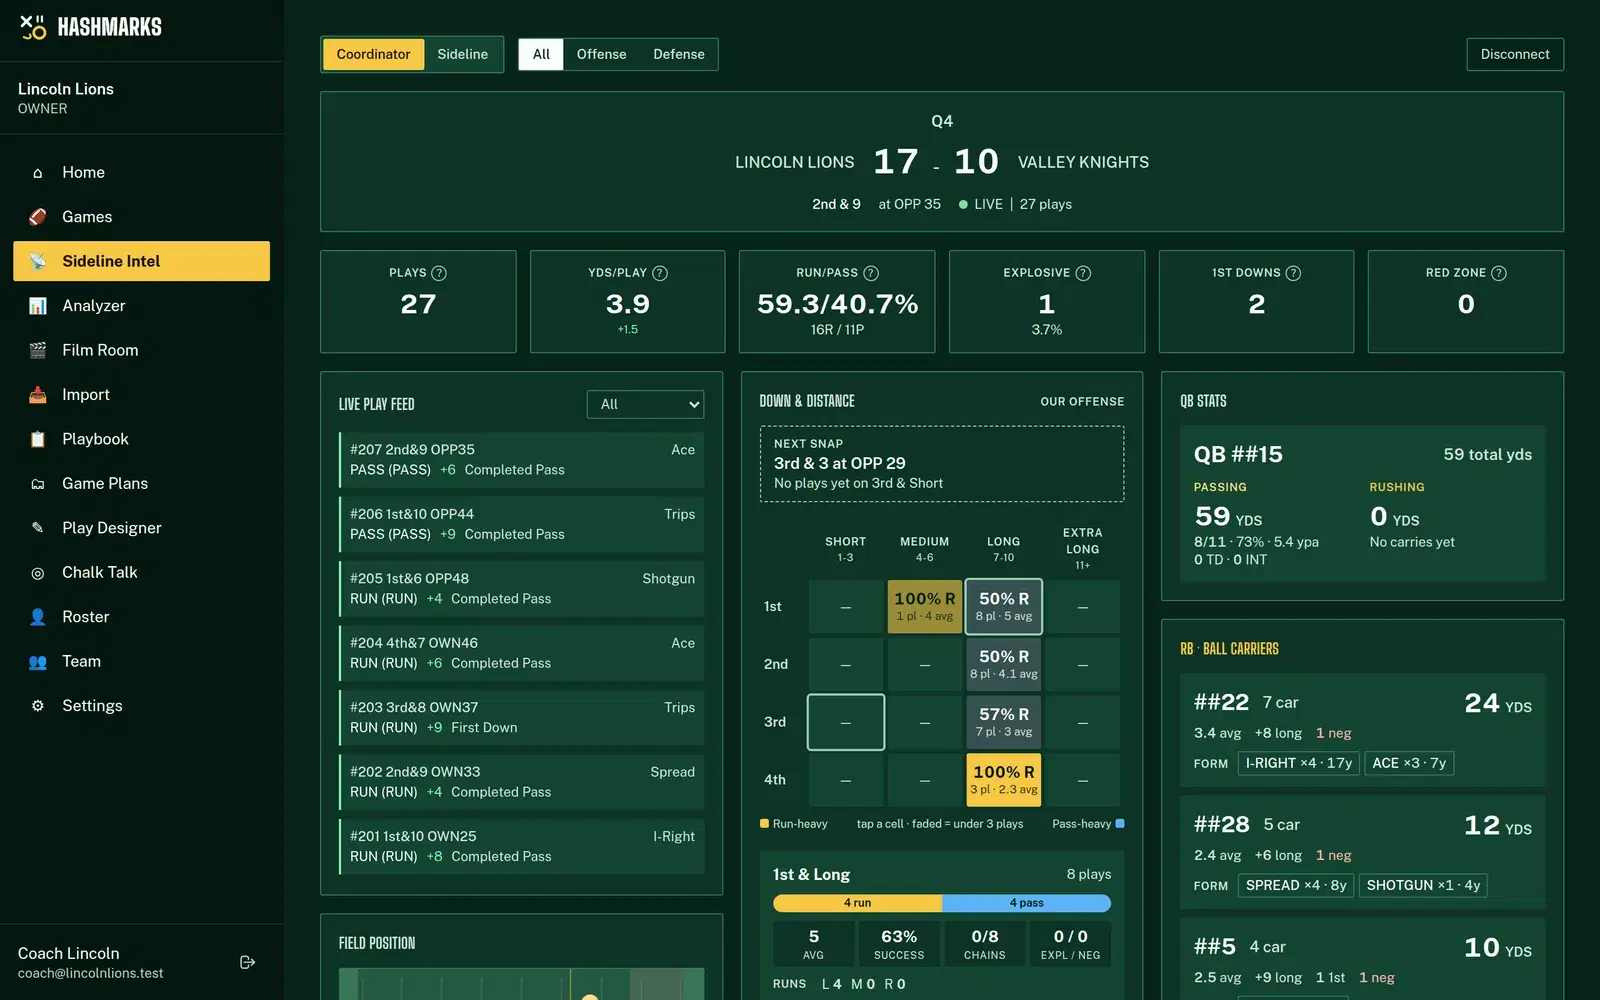
- Third- and fourth-down conversion, split by run and pass and by distance, on the Sideline Intel down-and-distance board.
- Red zone trips and results.
- Defense: tackles for loss, sacks and explosive plays allowed, by unit.
Deciding a quarterback battle? The Analyzer still compares every QB side by side (completion %, TDs, INTs, yards per attempt and targets), and the QB reports help page explains each metric.
Turn it into a scouting report
- Export any chart as a PNG for your slides or scouting packet.
- Export the play table as a CSV for your own spreadsheets.
- Export the whole report as a self-contained HTML file or print it to PDF, with the filters you used listed on it.
- AI scouting report: generate a written defensive game plan from the filtered plays, review the prompt first, and export it as a PDF. It uses your own OpenAI or Anthropic API key. It works best with a season's worth of plays (100 or more).
How to do it in Hashmarks
- Request free access, then add your season.
- Import a breakdown: Import → CSV Import, drop in your Hudl CSV, choose Single Game, Full Season or Scouting Data, check the column mapping and the preview, then import.
- Or chart live with the Play Tracker. Those plays land in the Analyzer automatically.
- Open Analyzer, pick the season and Our Data or Opponent.
- Filter to the situation you're game planning for and read the charts.
- Export PNGs, the CSV or the full report for your staff meeting.
Step-by-step import instructions and the column reference are in CSV import help. The Play Analyzer help page walks through every chart.
Where it fits in your week
- Friday: chart live, watch live tendencies on the sideline.
- Saturday: upload clips and break down the film with the play data already attached.
- Sunday: import next week's opponent, filter to 3rd down, build the report.
- Monday: put it in front of the staff.
Start your first scouting report free
Your breakdown data already has the answers. The Play Analyzer puts them on one page. Request free access, import a Hudl CSV and have your first report in front of the staff this week. See how Hashmarks compares on the home page.