Live Football Tendency Chart by Down and Distance
Build a football tendency chart that updates every snap: run/pass by down and distance, formation tells and alerts on the sideline. Free in Hashmarks.
By Hashmarks4 min readGame day
Every coordinator has asked it on the headset: "What do they do on 2nd and medium?" Usually the answer is a guess, or a tendency sheet printed on Thursday that doesn't know what happened in the first half. A football tendency chart is only useful if it's current. Hashmarks Sideline Intel builds yours live, from the plays your staff charts, and updates it after every snap.
What a tendency chart should answer
A down-and-distance tendency chart is simple: split every play by down (1st through 4th) and distance to go, and show how often it was a run or a pass. The hard part is keeping it up to date during the game, and knowing when a number is real.
The questions it should answer on the sideline:
- What's coming on this snap? Given the down, the distance and what's happened so far, which way do they lean?
- Is that lean real? Three plays isn't a tendency. Eight might be.
- Has anything changed? A team that ran on 1st down all of the first half and is now throwing is telling you something.
Sideline Intel's down-and-distance board
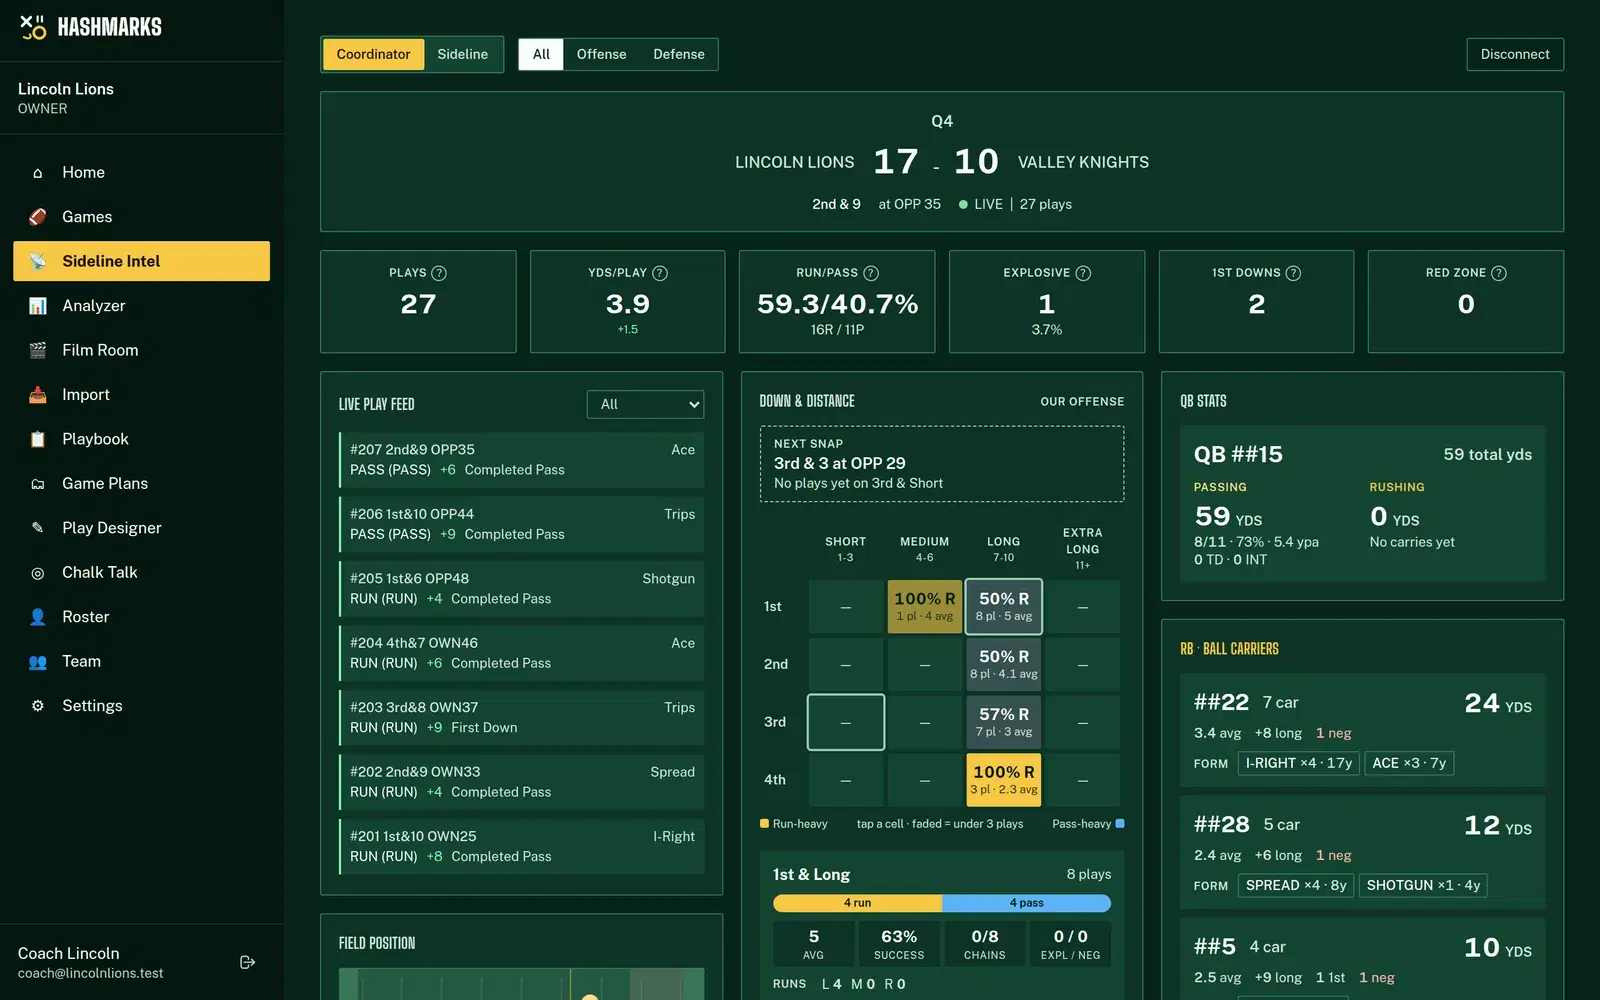
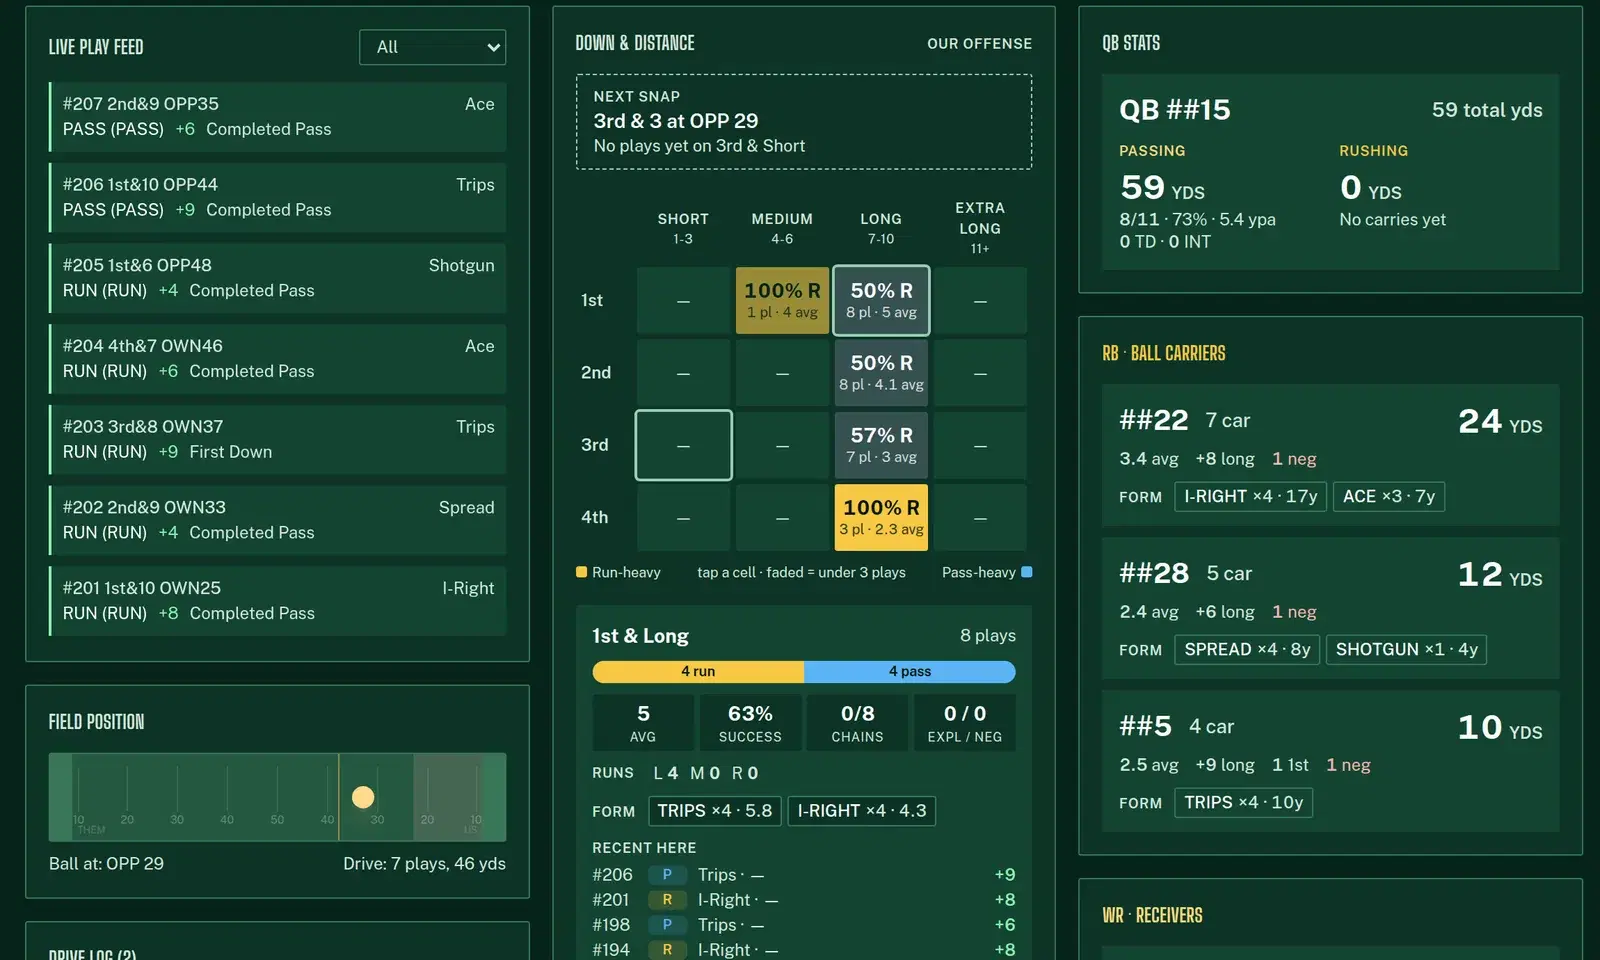
The center of Sideline Intel is a 4×4 board: down (1st to 4th) against distance buckets of short (1–3), medium (4–6), long (7–10) and extra long (11+). Each cell shows the run or pass percentage, the number of plays and the average gain, colored by which way it leans. Cells with fewer than three plays are faded so nobody on the headset over-reads a small sample.
A read-out for the next snap
Above the board, Next snap shows the exact situation coming up ("3rd & 3 at OPP 29") and what has happened in that bucket so far. When it says "No plays yet on 3rd & Short", that's an answer too.
Tap a cell for the details
Tap any cell and the breakdown opens under the board:
- the run/pass split and success rate
- how often it moved the chains, explosive and negative plays
- run direction (left, middle, right)
- the formations and play calls used in that situation
- the most recent plays from it
Below that are 3rd and 4th down conversions split by run and pass, a summary for each down and a last-10-plays trend against the game average.
PREDICTABLE flags
When a bucket goes 85% or more one way on four or more plays, the board marks it PREDICTABLE and raises an alert. That's the call your defensive coordinator wants before the snap, not after the film session.
Alerts that watch the game for you
Sideline Intel also runs a set of tendency alerts on every new play. From the code today, it flags:
- Heavy run / heavy pass: five straight runs or five straight passes
- Formation lock: three straight plays from the same formation
- 1st down tendency: running more than 75% on 1st down (after eight or more 1st downs)
- Play repeat: the same play call three or more times
- No motion: ten or more plays in a row without pre-snap motion
- Red zone concern: red zone efficiency under 50% after three or more trips
- QB target repeat and QB cold streak (four or more straight attempts without a completion)
- Situation lock: the PREDICTABLE buckets above
Point it at your own offense and it tells you when you are becoming predictable. Point it at a scouting game and it tells you what they do.
The rest of the dashboard
The board isn't the only widget. Sideline Intel also shows:
- Live play feed of every snap as it's logged
- QB stats: passing and rushing side by side for each QB, plus a hot-hand read on the last few throws when you're rotating quarterbacks
- Ball carriers and receivers: yards, touches, long gains and the formations each player gets the ball from
- Formation tendencies: plays, run and pass percentage, average gain and success rate per formation
- Field position, drive log, red zone report, explosive plays and motion analysis
There are two layouts. Coordinator view shows everything for the press box. Sideline view is a simplified layout for a phone on the field. You can switch between offense, defense or both.
Where the data comes from
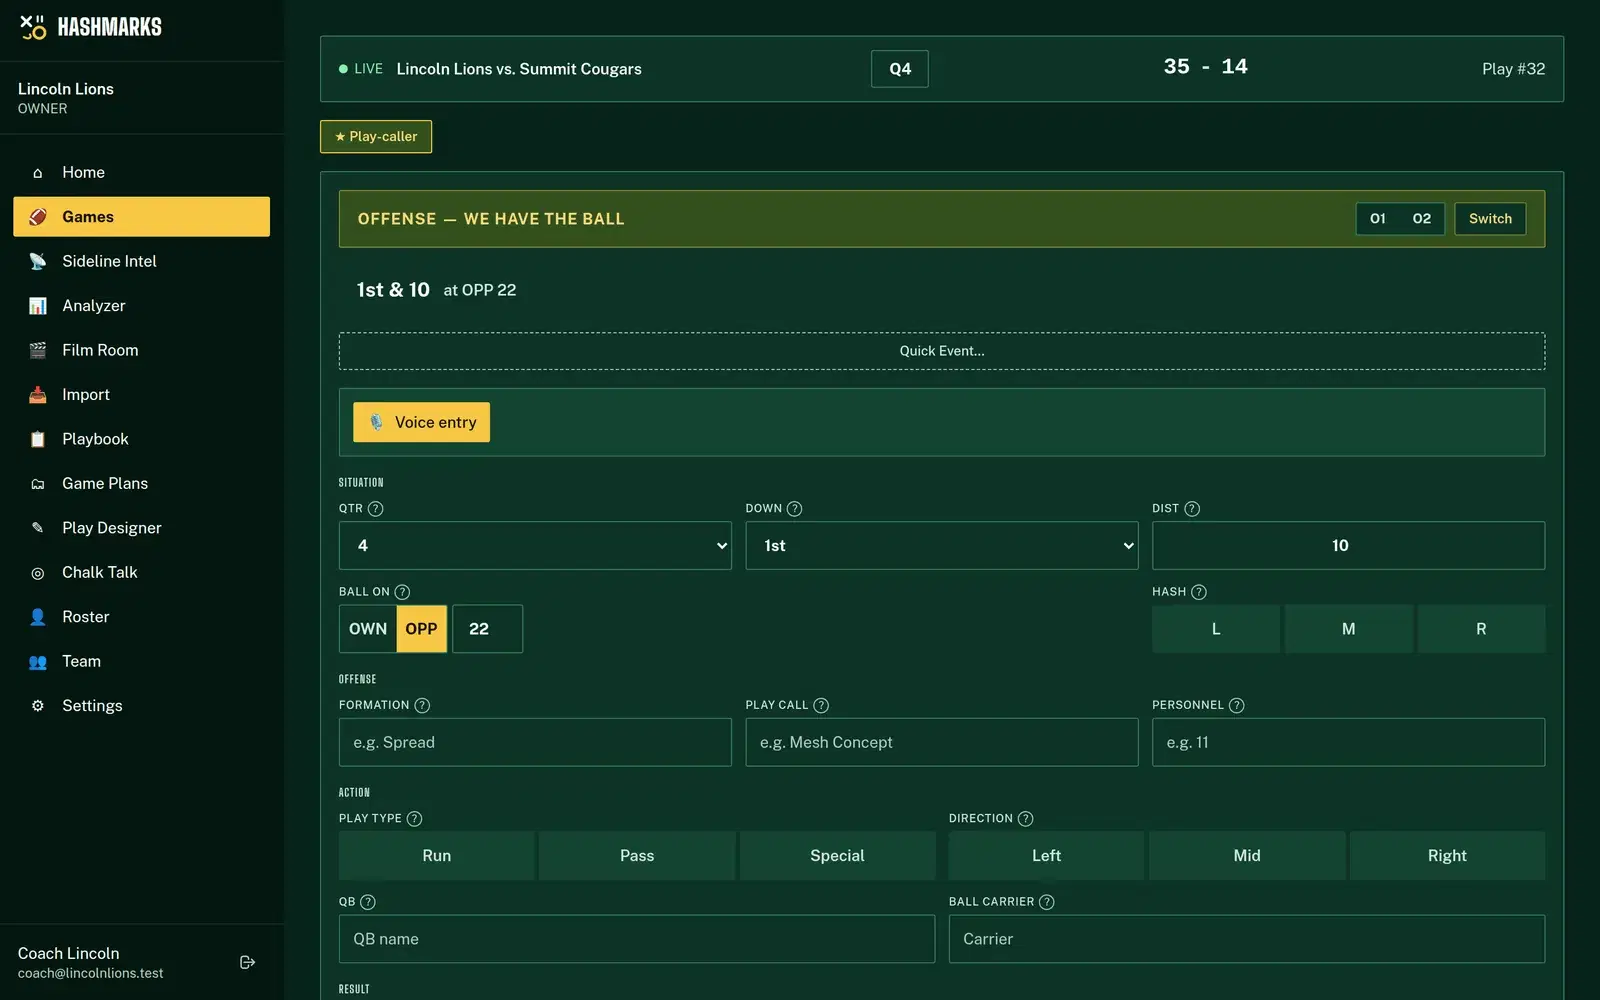
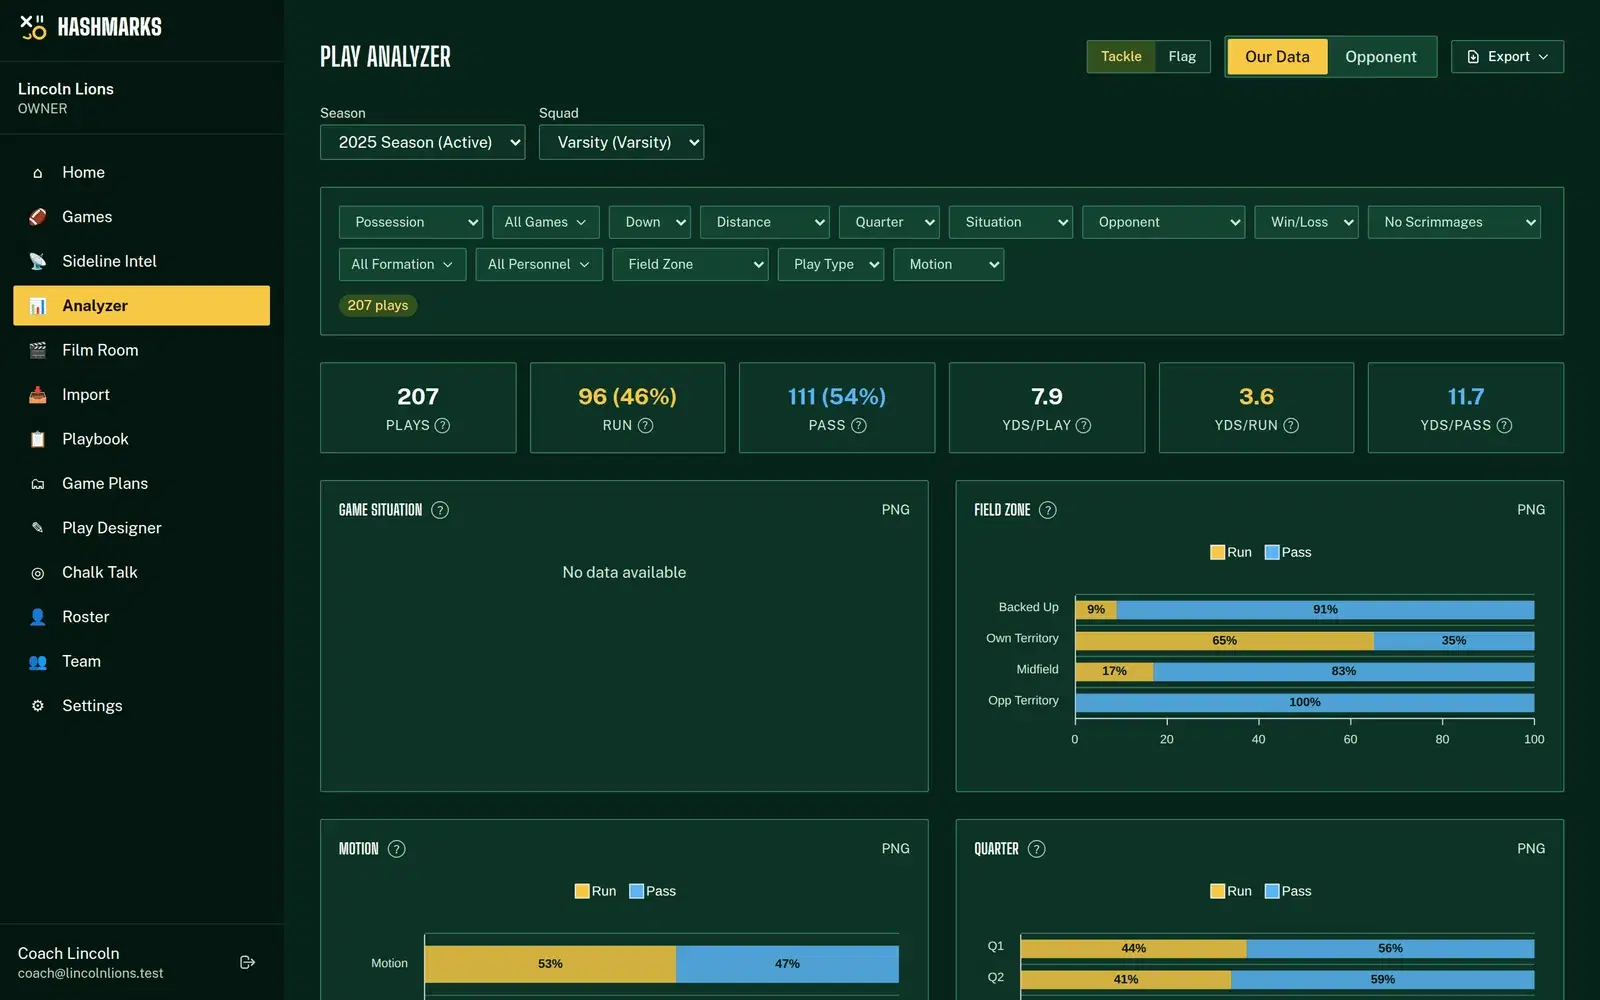
Sideline Intel doesn't need a separate data entry step. It reads the plays your staff logs in the Play Tracker, and updates as each play comes in, from any of your collectors. The same calculations power the post-game Play Analyzer, so the numbers on Friday match the numbers on Monday.
How to do it in Hashmarks
- Request free access, then add this week's game.
- Chart the game with the Play Tracker. Formation, play type and gain or loss are enough to start.
- Open Sideline Intel from the menu on a second device (a tablet in the press box works well) and pick the live game.
- Choose your view: Coordinator for the full dashboard, Sideline for the field.
- Watch the board and the alerts. Tap cells on the headset call. Compare halves at halftime.
For scouting, log an opponent's plays into a scouting game, or import their breakdown CSV, and the same board shows their tendencies before you play them. The Sideline Intel help page lists every widget.
Tips for using tendencies on game day
- Trust the sample size. Faded cells are there for a reason. Wait for four or five plays before you sell out.
- Watch for changes, not just leans. The last-10 trend against the game average is where adjustments show up.
- Pair it with formation. "Pass-heavy on 2nd & long" is good. "Pass-heavy on 2nd & long from Trips" is a call.
- Check your own tells. Coaches chart opponents. Opponents chart you too.
Get your tendency chart on the sideline
Stop printing Thursday's tendency sheet and hoping it holds. Request free access, chart your next game and let the board update itself. See the feature overview on the Hashmarks home page.